Option Explicit
'描画先のオブジェクト
Public objects As Object
'高さの分解能=最大値
Public pHight As Integer
'幅の分解能 最大1000 (バッファサイズに依存)
Public pWidth As Integer
'線の色の設定
Public LineColor As Long
'描画元の値を保持するバッファ
Private WidthScale(1000) As Integer
'バッファに値を追加して描画
Public Sub Step(setX As Integer)
Call add(setX)
Call show
End Sub
'バッファに値を追加
Public Sub add(setX As Integer)
Dim pos As Integer
' 0以下を取り除く
If setX < 0 Then setX = 0
' 配列の値をシフトして最後に追記
For pos = 0 To pWidth - 1
WidthScale(pos) = WidthScale(pos + 1)
Next pos
WidthScale(pWidth - 1) = setX
End Sub
'描画のみ
Public Sub show()
Dim scaleX As Double
Dim scaleY As Double
Dim height As Integer
Dim width As Integer
Dim pos As Integer
' 座標を計算する
height = objects.ScaleHeight
width = objects.ScaleWidth
scaleY = height / pHight
scaleX = width / pWidth
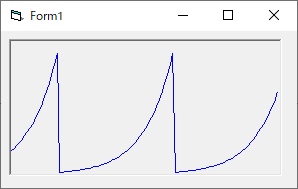
' 斜めに線を引く場合にはこのようにする
' objects.Line (0, 0)-(width, height), LineColor
' 配列の値でグラフを描画
For pos = 1 To pWidth - 1
Dim FrontPos As Integer
FrontPos = pos - 1
' 直線を描画する
objects.Line (scaleX * FrontPos, (height - scaleY * WidthScale(FrontPos))) _
-(scaleX * pos, (height - scaleY * WidthScale(pos))), LineColor
Next pos
End Sub
▼ フォームのコードを開いて次のコードを書き込みます。
Dim drows As Class1

Private Sub Form_Load()
    'グラフ作成
    Set drows = New Class1
    Set drows.objects = Form1.Picture1
    drows.pHight = 600
    drows.pWidth = 1000
    drows.LineColor = RGB(0, 0, 255)
End Sub
▼ フォームにタイマーを張り付けてグラフに値を追記すると描画できます。
Private Sub Timer2_Timer()
	Picture1.Cls
	drows.Step (描画する値)
End Sub
Option Explicit
'描画先のオブジェクト
Public objects As Object
'高さの分解能=最大値
Public pHight As Integer
'幅の分解能 最大1000
Public pWidth As Integer
'線の色の設定
Public LineColor As Long
'描画元の値を保持するバッファ
Private WidthScale(1000) As Integer
Private Sub Class_Initialize()
'バッファの初期化
Dim pos As Integer
For pos = 0 To 1000
WidthScale(pos) = -1
Next pos
End Sub
Public Sub Step(setX As Integer)
Call add(setX)
Call show
End Sub
Public Sub add(setX As Integer)
Dim pos As Integer
' 配列の値をシフトして最後に追記
For pos = 0 To pWidth - 1
WidthScale(pos) = WidthScale(pos + 1)
Next pos
WidthScale(pWidth - 1) = setX
End Sub
Public Sub show()
Dim scaleX As Double
Dim scaleY As Double
Dim height As Integer
Dim width As Integer
Dim pos As Integer
' 座標を計算する
height = objects.ScaleHeight
width = objects.ScaleWidth
scaleY = height / pHight
scaleX = width / pWidth
' 斜めに線を引く場合にはこのようにする
' objects.Line (0, 0)-(width, height), LineColor
' 配列の値でグラフを描画
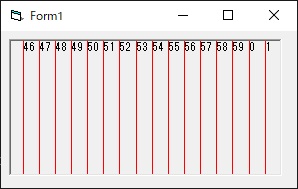
For pos = 1 To pWidth - 1
If WidthScale(pos) <> -1 Then
' 直線を描画する
objects.Line (scaleX * pos, 0)-(scaleX * pos, height), LineColor
' 文字を描画する
objects.CurrentX = scaleX * pos
objects.CurrentY = 0
objects.Print CStr(WidthScale(pos))
End If
Next pos
End Sub
Dim scale1 As Class2

Private Sub Form_Load()
    '目盛り作成
    Set scale1 = New Class2
    Set scale1.objects = Form1.Picture1
    scale1.pHight = 600
    scale1.pWidth = 1000
    scale1.LineColor = RGB(255, 0, 0)
End Sub

Private Sub Timer1_Timer()
    Dim sec As Integer
    sec = CInt(DateTime.Second(Now))
    '秒を見て1分に一度値を追加する
    If sec = 0 Then
        '分を書き込む
        scale1.add (CInt(DateTime.Minute(Now)))
    Else
        '-1を書き込むと線を引かない
        scale1.add (-1)
    End If

    Picture1.Cls
    scale1.show
End Sub
Dim drows As Class1
Dim scale1 As Class2
Dim counter As Integer

Dim x As Double

Private Sub Form_Load()
    'グラフ作成
    Set drows = New Class1
    Set drows.objects = Form1.Picture1
    drows.pHight = 600
    drows.pWidth = 100
    drows.LineColor = RGB(0, 0, 255)

    '目盛り作成
    Set scale1 = New Class2
    Set scale1.objects = Form1.Picture1
    scale1.pHight = 600
    scale1.pWidth = 100
    scale1.LineColor = RGB(255, 0, 0)

    x = 10
End Sub

Private Sub Timer1_Timer()
    x = x * 1.1
    If x > 600 Then x = 10
    counter = counter + 1
    If counter > 10 Then
        scale1.add (x)
        counter = 0
    Else
        '-1を書き込むと線を引かない
        scale1.add (-1)
    End If

    Picture1.Cls
    scale1.show
    drows.Step (x)
End Sub
Option Explicit
'描画先のオブジェクト
Public objects As Object
'高さの分解能=最大値
Public pHight As Integer
'幅の分解能 最大1000 (バッファサイズに依存)
Public pWidth As Integer
'線の色の設定
Public LineColor As Long
'保存ファイル名
Private filename As String
'描画元の値を保持するバッファ
Private WidthScale(1000) As Integer

'ファイルから読み込み
Public Function file_load(file As String)
    filename = file
    'ファイルからの復元
    If filename <> "" Then
On Error GoTo err
        Dim fileNo As Integer
        fileNo = FreeFile
        Open App.Path + "\" + filename For Input As #fileNo
        Dim pos As Integer
        For pos = 0 To 1000
            Dim buff As String
            Input #fileNo, buff
            WidthScale(pos) = CInt(buff)
        Next pos
err:
        Close #fileNo
    End If
End Function

'ファイルに書き込む
Public Sub file_save()
    'ファイルに保存
    If filename <> "" Then
On Error GoTo err
        Dim fileNo As Integer
        fileNo = FreeFile
        Open App.Path + "\" + filename For Output As #fileNo
        Dim pos As Integer
        For pos = 0 To 1000
            Write #fileNo, CStr(WidthScale(pos))
        Next pos
err:
        Close #fileNo
    End If
End Sub

'バッファに値を追加して描画
Public Sub Step(setX As Integer)
    Call add(setX)
    Call show
End Sub

'バッファに値を追加
Public Sub add(setX As Integer)
    Dim pos As Integer
'   0以下を取り除く
    If setX < 0 Then setX = 0

'   配列の値をシフトして最後に追記
    For pos = 0 To pWidth - 1
        WidthScale(pos) = WidthScale(pos + 1)
    Next pos
    WidthScale(pWidth - 1) = setX
End Sub

'描画のみ
Public Sub show()
    Dim scaleX As Double
    Dim scaleY As Double
    Dim height As Integer
    Dim width As Integer
    Dim pos As Integer

'   座標を計算する
    height = objects.ScaleHeight
    width = objects.ScaleWidth
    scaleY = height / pHight
    scaleX = width / pWidth

'    斜めに線を引く場合にはこのようにする
'    objects.Line (0, 0)-(width, height), LineColor
'   配列の値でグラフを描画
    For pos = 1 To pWidth - 1
        Dim FrontPos As Integer
        FrontPos = pos - 1

'       直線を描画する
        objects.Line (scaleX * FrontPos, (height - scaleY * WidthScale(FrontPos))) _
        -(scaleX * pos, (height - scaleY * WidthScale(pos))), LineColor
    Next pos
End Sub
Option Explicit
'描画先のオブジェクト
Public objects As Object
'高さの分解能=最大値
Public pHight As Integer
'幅の分解能 最大1000
Public pWidth As Integer
'線の色の設定
Public LineColor As Long
'保存ファイル名
Private filename As String
'描画元の値を保持するバッファ
Private WidthScale(1000) As Integer
Private Sub Class_Initialize()
'バッファの初期化
Dim pos As Integer
For pos = 0 To 1000
WidthScale(pos) = -1
Next pos
End Sub
'ファイルから読み込み
Public Function file_load(file As String)
filename = file
'ファイルからの復元
If filename <> "" Then
On Error GoTo err
Dim fileNo As Integer
fileNo = FreeFile
Open App.Path + "\" + filename For Input As #fileNo
Dim pos As Integer
For pos = 0 To 1000
Dim buff As String
Input #fileNo, buff
WidthScale(pos) = CInt(buff)
Next pos
err:
Close #fileNo
End If
'再開場所に線を引く
WidthScale(pWidth - 1) = -2
End Function
'ファイルに書き込む
Public Sub file_save()
'ファイルに保存
On Error GoTo err
If filename <> "" Then
Dim fileNo As Integer
fileNo = FreeFile
Open App.Path + "\" + filename For Output As #fileNo
Dim pos As Integer
For pos = 0 To 1000
Write #fileNo, CStr(WidthScale(pos))
Next pos
err:
Close #fileNo
End If
End Sub
'バッファに値を追加して描画
Public Sub Step(setX As Integer)
Call add(setX)
Call show
End Sub
'バッファに値を追加
Public Sub add(setX As Integer)
Dim pos As Integer
' 配列の値をシフトして最後に追記
For pos = 0 To pWidth - 1
WidthScale(pos) = WidthScale(pos + 1)
Next pos
WidthScale(pWidth - 1) = setX
End Sub
'描画のみ
Public Sub show()
Dim scaleX As Double
Dim scaleY As Double
Dim height As Integer
Dim width As Integer
Dim pos As Integer
' 座標を計算する
height = objects.ScaleHeight
width = objects.ScaleWidth
scaleY = height / pHight
scaleX = width / pWidth
' 斜めに線を引く場合にはこのようにする
' objects.Line (0, 0)-(width, height), LineColor
' 配列の値でグラフを描画
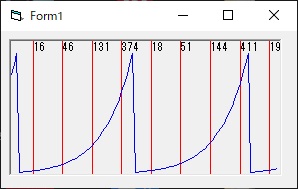
For pos = 1 To pWidth - 1
' -1だと線を引かない、-2だとSと表示し赤線を引く(再開時)
If WidthScale(pos) = -2 Then
' 直線を描画する
objects.Line (scaleX * pos, 0)-(scaleX * pos, height), RGB(255, 0, 0)
' 文字を描画する
objects.CurrentX = scaleX * pos
objects.CurrentY = 0
objects.ForeColor = RGB(255, 0, 0)
objects.Print "S"
ElseIf WidthScale(pos) <> -1 Then
' 直線を描画する
objects.Line (scaleX * pos, 0)-(scaleX * pos, height), LineColor
' 文字を描画する
objects.CurrentX = scaleX * pos
objects.CurrentY = 0
objects.ForeColor = LineColor
objects.Print CStr(WidthScale(pos))
End If
Next pos
End Sub